Who wants to leave Kolkata ?
This is an excerpt from a recent release of the US consulate, Kolkata.
2005 Visa Statistics: Last Year over 25,000 applications were processed in Calcutta.
Visa applications were received in the following categories:
- Business/Tourist (B1/B2) 54%
- Temporary Workers (H) 18%
- Intercompany Transfers (L) 15%
- Students (F/M) 7%
- Crew (C1/D) 3%
- Exchange Visitors (J) 3%
- Performers (P) less than 1%
- Religious (R) less than 1%
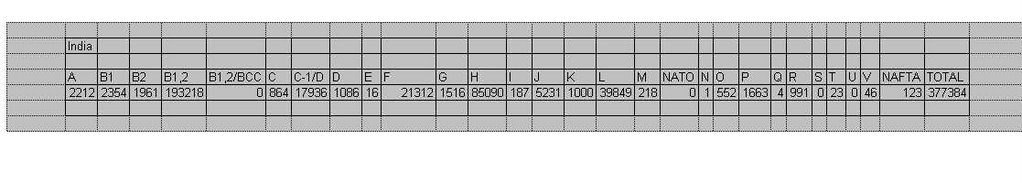
Interesting to compare this with figures from India as a whole from this report :
B1/B2 = 52.3%
H = 22.5%
L = 10%
F/M = 5%
C1/D = 5%
And Kolkata consulate as a whole issued just 25000/377384 = 6% (!!!) of the total amount of visas from India
Now since these numbers include the numbers from Kolkata, the differences in reality are greater than they look - e.g. consider H1s. Even though it appears that of the total number of visas from Kolkata, the % of H1's (18%) is less than what the average number of H1 seekers are of the total, in reality, Kolkata has issued far lesser, because the total has been diluted by the inclusion of numbers from Kolkata, which have reduced the differences. So, having said that, lets see where we stand. More B1/B2's implies more parents visiting. Resonates well with what I've observed - that a lot of people come back to Kolkata to retire. Less students (F1) and workers (H1) - generally lower levels of economic & educational activity. More L1s caught me by suprise, but I think I get it after discussing this with my friends. Apparently L1s are more of indentured laborers. So due to the less choice, Kolkata employers are getting away by putting more and more employees into L1s rather than H1s which are tranferable between employers. Hmmm .... I thought it would be more meaningful to compare numbers of each consulate independently and look at regional choice but I could not get my hand on the individual stats. Overall seems we are in ballpark.
posted by Bengali Guy at 11:22 PM
0 comments
![]()
![]()
